Introduction
The National Report on Schooling in Australia 2014 is an annual report on Australia’s school education sector. It has been produced by the Australian Curriculum, Assessment and Reporting Authority (ACARA) on behalf of the Education Council1.
The report highlights progress in 2014 towards the Melbourne Declaration on Educational Goals for Young Australians agreed by Australian education ministers in 2008.
The National Report on Schooling in Australia 2014 addresses the eight areas of commitment to action specified in the Melbourne Declaration. It describes the national policy and reporting context for school education in Australia and reports against the nationally agreed key performance measures (KPMs) for schooling, covering student participation, student achievement in national assessments and student transitions to further education and work. A selection of other statistical information on Australian schooling in 2014 and for the years 2009–2014 is included in the report, with more extensive data sets accessible through the National Report on Schooling Data Portal.
The National Report on Schooling in Australia Data Portal is a new component of the national report on schooling in Australia. The data portal provides readers with interactive access to a wide range of data on schooling in Australia, including general statistics on enrolments and funding, and data on the agreed KPMs. In most cases, the portal allows readers to download data at the national level, but also by state and territory, by school sector, by calendar year and by other breakdowns such as gender and Indigenous status.
This is the sixth annual national report on schooling in Australia to address the Melbourne Declaration and the twenty-sixth annual report overall.
The national reports on schooling in Australia 2009, 2010, 2011, 2012 and 2013 are available on the ACARA website. Editions prior to 2009 are available on the SCSEEC website.
1 The (COAG) Education Council replaced the Standing Council on School Education and Early Childhood (SCSEEC) in July 2014 as the ministerial council with responsibility for schooling in Australia.
Overview of the report
Overview of Part 1
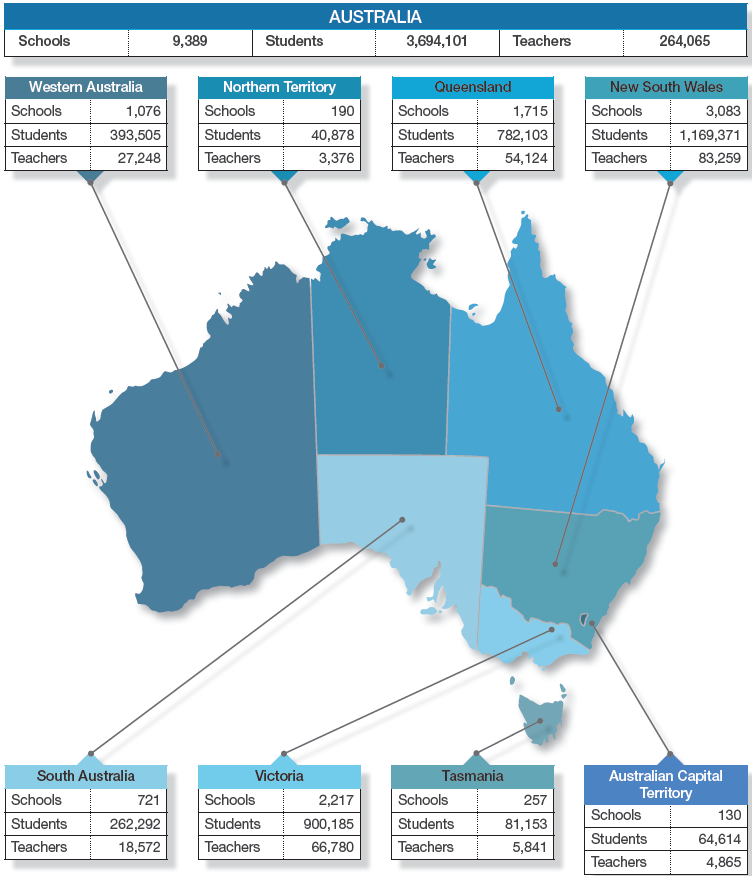
Part 1 – Schools and schooling, provides information on the status of Australian schooling in 2014, including school, student and teacher numbers, school structures and funds used for school education.
In Australia, responsibility for school education rests mainly with the six state and two territory governments2.
All states and territories provide for 13 years of formal school education. Primary education, including a preparatory year, lasts for either seven or eight years and is followed by secondary education of six or five years respectively. Typically, schooling commences at age five, is compulsory from age six until age 17 (with provision for alternative study or work arrangements in the senior secondary years) and is completed at age 17 or 18. School structures and age requirements in states and territories are summarised in Part 1.4.
The majority – 71 per cent – of schools are government schools, established and administered by state and territory governments through their education departments or authorities. The remaining 29 per cent are non-government schools, mostly associated with religious organisations.
Non-government schools are established and operated under conditions determined by state and territory governments through their registration authorities. School numbers are shown in Part 1.1.
Around two thirds (65 per cent) of school students are enrolled in government schools and approximately one third (35 per cent) in non-government schools. Part 1.2 reports on numbers of students by school sector and state and territory.
Staff numbers closely reflect enrolments, with 64 per cent of school teachers employed by the government school sector and 36 per cent by non-government schools. Part 1.3 reports on staff numbers and student/teacher ratios.
Schools are funded through a combination of state/territory government funding, Australian government funding, fees and charges and other parental/private contributions. School funding arrangements and data are reported in Part 1.5.
2 New South Wales (NSW), Victoria (Vic.), Queensland (Qld), South Australia (SA), Western Australia (WA), Tasmania (Tas.), Northern Territory (NT) and Australian Capital Territory (ACT).

Notes
Student numbers are individuals (full-time students plus part-time students). Teacher numbers are full-time equivalent (FTE).
Source: ABS, Cat. No. 4221.0, Schools, Australia, 2014
Overview of Part 2
Part 2 – Policies and priorities, outlines the national policy context for Australian schooling in 2014 and reports against the commitments to action agreed by Australian education ministers in the Melbourne Declaration on the Educational Goals for Young Australians.
Part 2.1 of this report summarises the roles of the Council of Australian Governments (COAG) and the Education Council in deciding agreed national policy and initiatives for education. Part 2.2 outlines the goals and commitments contained in the Melbourne Declaration and the COAG targets for education.
Parts 2.3 – 2.10 report on progress in implementing the Melbourne Declaration commitments to action with a focus on developments in 2014.
Progress towards the commitments to action reported for 2014 include:
- the remaining national partnership agreements on schooling undertaken through COAG between 2009 and 2014 were completed
- all states and territories were implementing the Australian Professional Standards for Teachers, as part of a nationally consistent approach to teacher registration (from 2013)
- all states and territories were implementing the Australian Curriculum in English, Mathematics, Science and History
- annual tests in literacy and numeracy for Years 3, 5, 7 and 9 were conducted through the National Assessment Program - Literacy and Numeracy (NAPLAN) for the seventh time
- the cohort that undertook the first NAPLAN tests in Year 3 in 2008 – took part in their fourth and final NAPLAN tests as Year 9 students in 2014
- education ministers agreed that NAPLAN tests will be conducted online from 2017 with states and territories opting in to online testing over two to three years
- the three-yearly NAP sample assessment in Information and Communication Technology (ICT) Literacy for Year 3 and 6 students was conducted for the fourth time
- the fifth release of the My School website occurred
- the Education Council released Preparing Secondary Students for Work – A framework for vocational learning and VET delivered to secondary students
Part 2 also includes contributions from states and territories on how the commitments to action have been addressed within jurisdictions.
Overview of Part 3
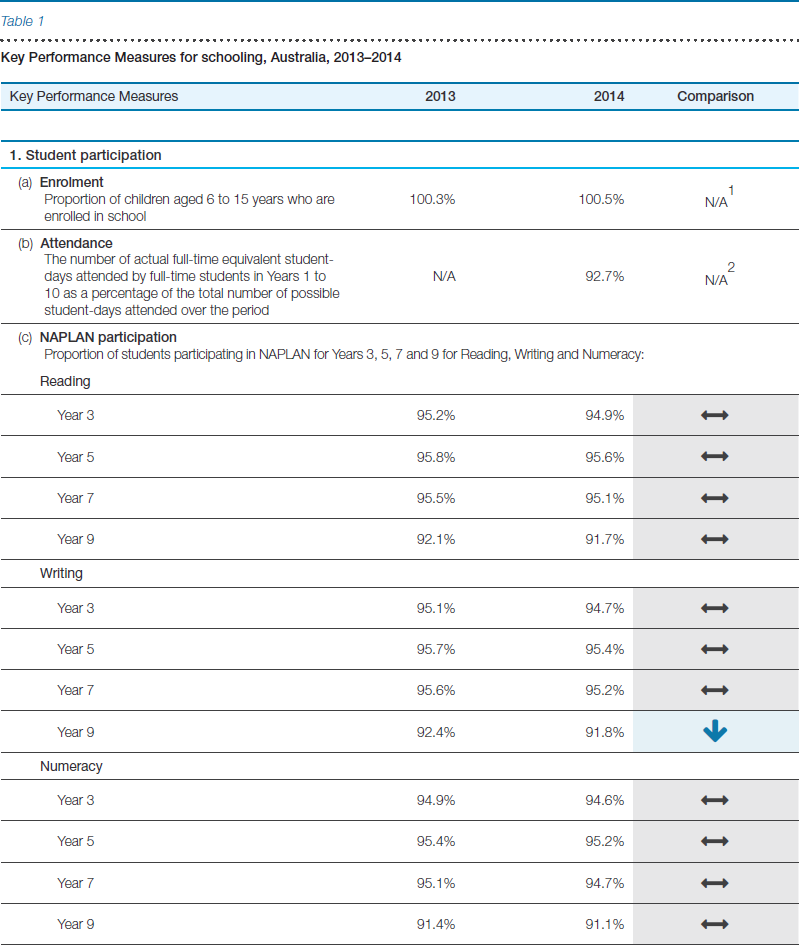
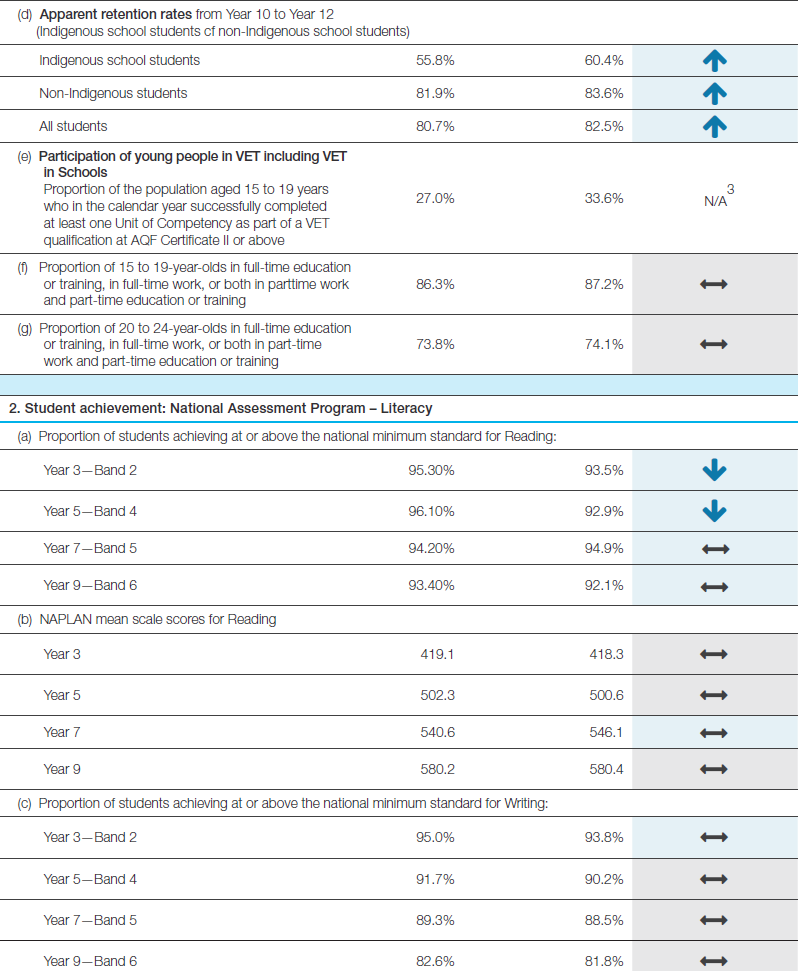
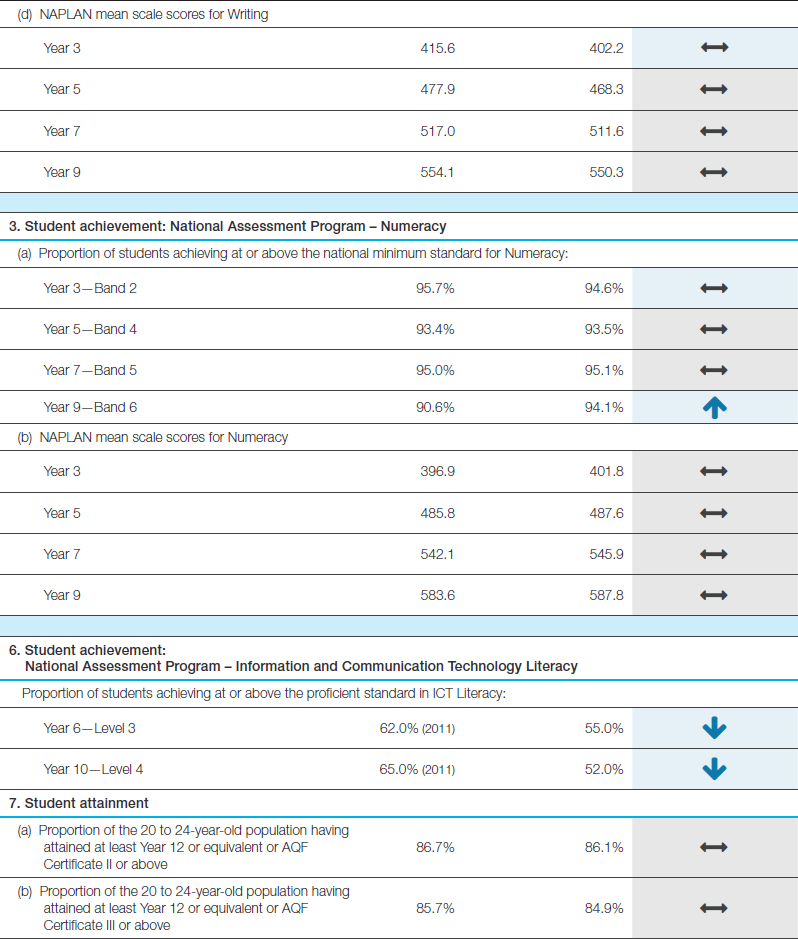
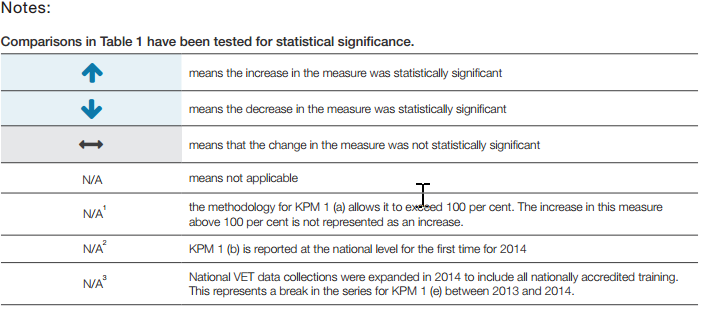
Part 3 – Measuring and reporting performance, reports on the performance of Australian schooling in 2014, using the nationally agreed key performance measures (KPMs) for schooling specified in the Measurement Framework for Schooling in Australia 2012.
Part 3 reports on 16 of the 23 agreed KPMs3 along with, in some cases, associated COAG targets. The measures are reported at the national level, and by various breakdowns such as school sector, state and territory, school year and Indigenous status. For selected KPMs, time series for the six years 2009–2014 since the Melbourne Declaration are also included. Where relevant breakdowns or time series are not reported in Part 3, a link to the National Report on Schooling Data Portal or other data source is provided.
Data reported for 2014 include:
- The average national attendance rate for students in Years 1–10 was 92.7 per cent. At 83.5 per cent, the average attendance rate for Aboriginal and Torres Strait Islander students was 9.7 percentage points lower than for non-Indigenous students (93.2 per cent). Attendance rates were lower for Years 8, 9 and 10 than for Years 1–7.
- NAPLAN participation rates for reading, writing and literacy were over 90 per cent for each of Years 3, 5, 7 and 9 but were lower in each domain for Year 9 than for Years 3, 5 and 7.
- The proportion of students achieving at or above the minimum standard in NAPLAN tests was over 90 per cent for all Year groups tested in reading, and numeracy and for Years 3 and 5 in writing.
- There were significant decreases in the proportions of students achieving at or above the proficient standard in ICT Literacy since this sample assessment was last conducted in 2011. For Year 6 students, this measure fell from 62 per cent in 2011 to 55 per cent in 2014. For Year 10 students, the proportion decreased further, from 65 per cent in 2011 to 52 per cent in 2014.
- The proportion of students proceeding to Year 12 (as measured by the apparent retention rate from Year 10 to Year 12) rose by 1.8 percentage points to 82.5 per cent. The apparent retention rate from Year 10 to Year 12 for Aboriginal and Torres Strait Islander students rose by 4.6 percentage points to 60.4 per cent, reducing the gap between Indigenous and non-Indigenous rates from 26.1 to 23.2 percentage points.
- The proportion of the 20 to 24-year-old population that has attained at least Year 12 or equivalent or AQF Certificate III or above remained stable at around 85 per cent.
3 The remaining seven KPMs do not apply to the 2014 reporting year. For example, NAP international assessments and NAP sample assessments in Science Literacy and Civics and Citizenship were not conducted in 2014.
Download:
National Report on Schooling in Australia 2014 (PDF)
An accessible version of this report is under development and will available soon. In the meantime, if you would like a hard copy of our report, or have problems viewing the PDF, please email info@acara.edu.au